Actuarial model theory validated by market pratice
Eric Galiègue, Chairman of SFAF's Valuation Committee, discusses behavioural equity valuation, which makes it possible to exploit the theoretical and empirical relationship between PER and interest rates.
Whereas theoretical valuation is a projection into the future and transforms growth forecasts and measures of risk into value, behavioural valuation uses the share price and is based on the past behaviour of the company's price. The assumption is made that the long-term price is not very different from the value, even if it may deviate significantly from it over the long term.
A first approach to behavioural valuation consists of directly comparing the share's P/E with the risk-free rate.
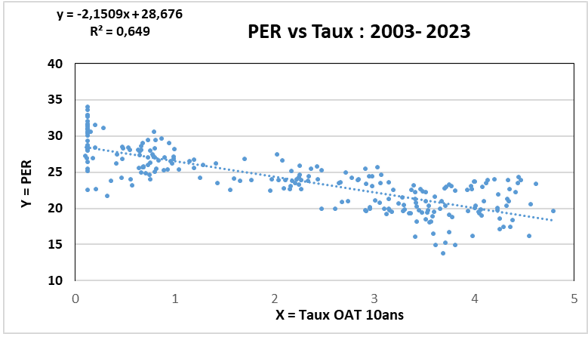
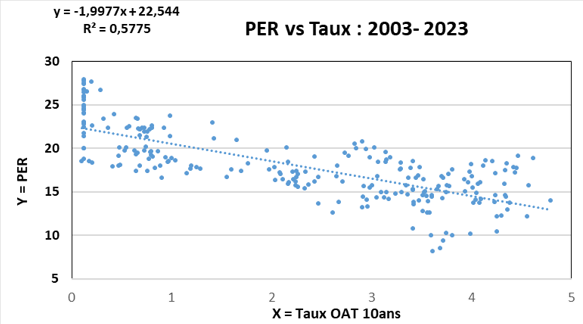
This gives the type of "X-Y" graphical representation shown below with the examples of Essilor Luxottica and Pernod Ricard, where X = interest rate and Y = PER. This shows the strong relationship between the earnings multiple and the yield on 10-year French government bonds.
Essilor Luxottica
Pernod Ricard
Source : Factset et Phiadvisor Valquant
The coefficient of determination (squared correlation coefficient) of almost 65% for Essilor Luxottica shows that the variance in the interest rate explains almost 2/3 of the variance in the P/E, which is significant.
The coefficients on the line can be interpreted as follows: The constant of 28.7 represents what the PER would be for a zero rate, and the sensitivity of the PER to the interest rate is 2.1. This means that when interest rates rise by 10%, the P/E falls by 21%.
By applying this empirical model, we can calculate a 'theoretical' P/E, based on the historical relationship described above (which corresponds to the straight line on the X-Y chart).
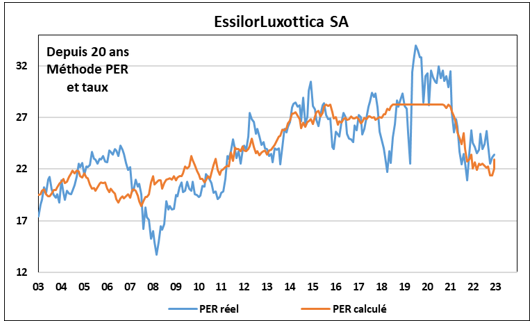
Source : Factset et Phiadvisor Valquant
By multiplying this theoretical P/E with the EPS expectations at the time, we can determine a theoretical share price for Essilor Luxottica:
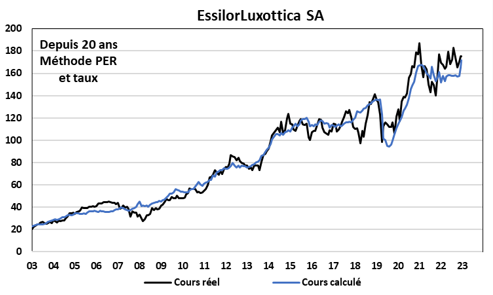
Source : Factset et Phiadvisor Valquant
The values of the coefficients described above are shown in the following table, for the shares currently making up the CAC 40:
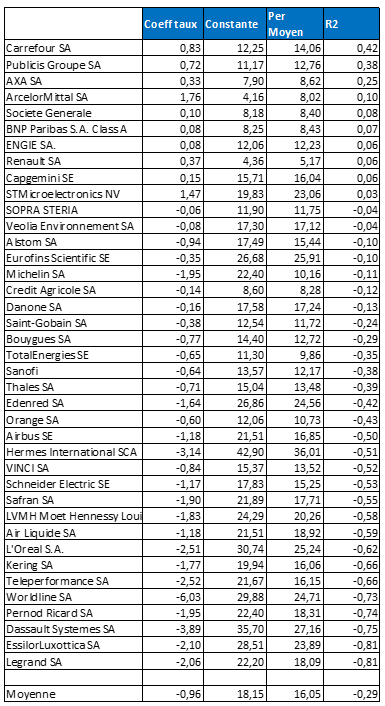
Source : Factset et Phiadvisor Valquant
This table calls for a number of comments.
- Correlation rate: the average coefficient is negative (-29%), but not as high as expected. The correlation is even positive for a number of stocks: this shows that, from an empirical point of view, the interest rate does not explain the level of the P/E for many stocks. Furthermore, this correlation rate reflects two different periods over the last 20 years: a period of positive correlation between P/Es and interest rates, until around 2011, and a period of return to negative correlation, since 2011.
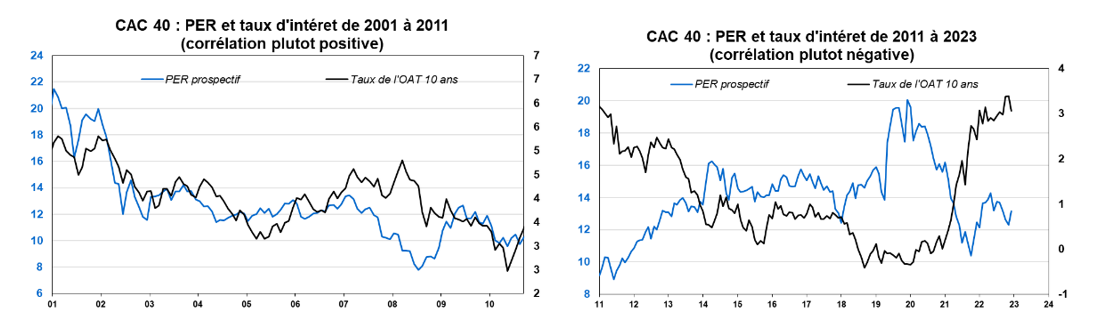
Source : Factset et Phiadvisor Valquant
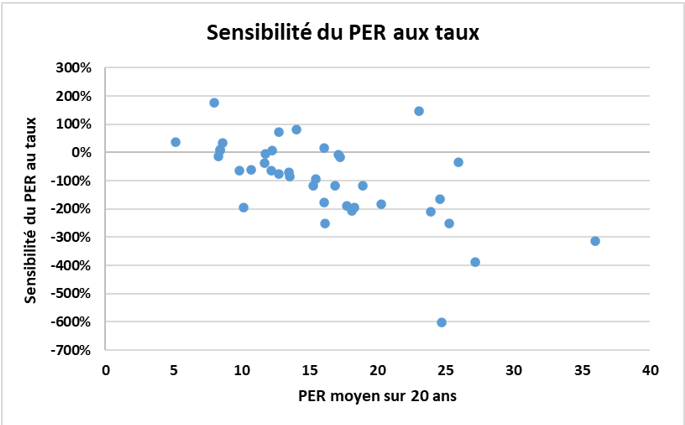
- Coefficient applied to interest rates: the overall average of the coefficient applied to interest rates, i.e. the sensitivity of the P/E to interest rates, is -0.96, which is in line with expectations, but the differences between stocks are considerable, ranging from -6 (Worldline) to 1.76 (Arcelor Mittal).
- The y-intercept: this corresponds to the value of the P/E at zero interest rate and is significantly higher than the average P/E observed over the entire period, which is in line with expectations.
- It appears that high P/E stocks, the so-called "Growth" stocks, show a more negative R2.
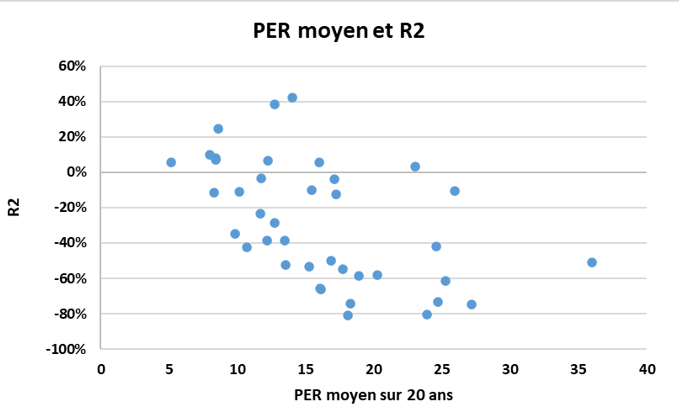
Source : Factset et Phiadvisor Valquant
- Similarly, the higher the P/E, the greater the sensitivity of the P/E to interest rates.