
In order to correctly value a company's stock, the relevance of the discount rate depends on a number of rules, as proposed by Eric Galiègue, Chairman of the SFAF Valuation Committee.
The discount rate plays a central role in any valuation method. It is used to convert uncertain future cash flows into their present value. This present value is none other than the share valuation, often compared with its market price. For this "magic" to work, the discount rate must be set with great rigor. And yet, there is no precise concrete convention for it. The members of SFAF's Valuation Committee have reviewed the concept of the discount rate and proposed a few simple rules for setting it.
The discount rate is usually presented in several ways. On the investor's side, the discount rate is an expected rate of return. It corresponds to what is required to hold a risky stock, often compared with holding a "risk-free" bond (issued by the French government). It therefore comprises the "risk-free" rate and a "risk premium" reflecting the various risks facing future cash flows. It is often said that the risk premium "remunerates the risk": if it is zero, equities cannot be attractive compared to bonds.
According to the usual conventional representation :
Discount rate = rate demanded by the investor = r = r* + pr
On the company's side, the discount rate is made up of two elements: the dividend, the portion of earnings intended to remunerate the shareholder (equity), and future growth. It is the need to finance this growth that justifies the company retaining part of its earnings. The market counterpart of the dividend is the yield (dividend divided by the share price), while the capital gain is the counterpart of future growth (retained earnings).
According to the usual conventional representation :
Discount rate = rate of return on equity = r = DIV/stock price + g = Dividend yield + capital gain
Thus, over the long term, the share of dividend yield in total profitability should be comparable to the company's payout ratio.
The theoretical concept has been presented "ex ante", but we can try to measure it "ex post", by observing the facts. How can we set an average discount rate, which corresponds to an average risk? The discounting of future cash flows concerns the long term, implicitly several decades. However, we know the distant past, which corresponded to a distant future: it is possible to draw on observations from the past to estimate the discount rate to be used.
We have measured the ex-post profitability of 57 stocks currently making up the SBF 120, with a 30-year price history. Equal-weighted average annual share price performance is 4.4%, while the average yield ratio is 3%. The average total return has therefore been 7.4% over the last thirty years. The ratio between 3% and 7.4% is estimated with 40% payout ratio, average level observed over the long term. Market finance is very much in line with corporate finance.
This market data seems to us to be consistent with the long-term earnings growth of the SBF 120. Indeed, according to Factset data, EPS (earnings per share) for the SBF 120 index has risen by 5.3% per year since 1999. This is slightly higher than the average capital gain (4.4%), but remain within the same order of magnitude.
Adding the average dividend yield (3% = DIV/price) to long-term earnings growth (5.3% = g) gives 8.3%, the second estimate of the discount rate.
If we subtract from this 8.3% the 30-year average rate for French 10-year bonds (3.7%), we find an implicit risk premium of 4.6%, which would have been observed on average over the past 30 years. Rounded to 4.5%, it seems to us to constitute a useful operational basis for setting the discount rate, for an average risk.
By comparing theory with reality, we can determine the following benchmarks, which are useful for the appraiser:
r = r* + pr = 3.7% + 4.6% = 8.3
r = DIV/course + g = 3% + 5.3% = 8.3%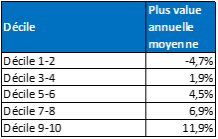
Source: Factset and Phiadvisor Valquant
The 12 highest average annual gains over 30 years
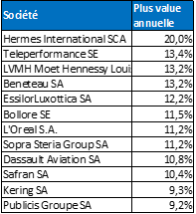
Source: Factset and Phiadvisor Valquant
The 12 lowest average annual stock market performances over 30 years
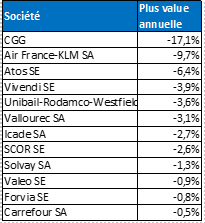
Source: Factset and Phiadvisor Valqua