
Risk of a correction in New York and continued rise in Tokyo
Rainsy Sam, a member of the SFAF, looks back at the assessment of the financial markets in 2023 in order to provide an outlook for 2024. Before determining what can be expected of the financial markets in 2024, where do they stand at the end of 2023?
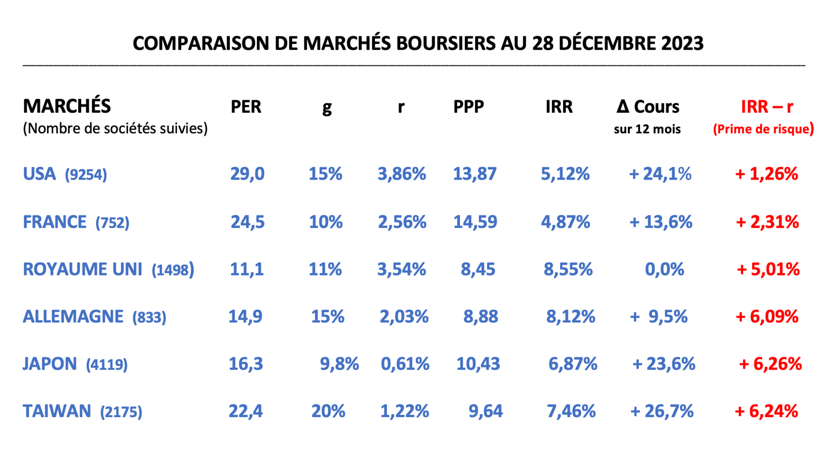
Several observations can be made, as shown in the table at the end of this article.
As at 28 December 2023, the P/Es for the various markets are very disparate, ranging almost threefold: 11.1 for the UK and 29.0 for the USA. Performance over the past year as a whole is also very mixed, ranging from 0% for the UK to 24% for the US and Japan, and even 26% for Taiwan.
However, if we adjust P/Es to take account of differences in earnings growth rates and interest rates, stock markets appear to be valued in a less contrasting way. The PPP (potential payback period) varies within a much narrower range (less than double): 8.45 for the UK and 14.59 for France
The internal rate of return (IRR) for each market can be calculated directly from the PPP for that market. The IRR is the discount rate that needs to be applied to future profits over the period corresponding to the PPP in order to equalise these profits with the current share price. Unlike the gross P/E, whose levels vary widely and sometimes become absurd, the IRR has significant and realistic levels for all shares on all markets (here between 4.87% and 8.55%).
The IRR of a share should be compared with the return on a long-term risk-free bond, the difference between the two rates being the risk premium specific to each share or each market. The risk premium - which can also be seen as a safety margin for the investor - may temporarily be set at a level that is not fully justified. It may then give rise to corrective movements.
At 28 December 2023, the risk premium for the US market was 1.26%. This level is historically low. It is also very low compared with other major markets, such as Japan (6.24%). With such a high risk premium, the Japanese market becomes relatively very attractive.
On the basis of the fundamentals examined above (P/E, earnings growth rate and interest rate), it is possible to argue that the US market has very limited upside potential in 2024 and may even correct with a rise in the risk premium.
On the other hand, with a relatively high risk premium of 6.24%, the Japanese market should continue to rise in the new year. With a risk premium of 6.09% and 6.24% respectively, the German and Taiwanese markets also offer good prospects of appreciation, notwithstanding particular political considerations.
The reliability of these forecasts, based on the PPP and IRR concepts, depends on the reliability and accuracy of the forecast data entered into the model, in particular the estimated earnings growth rate for the next 12 to 24 months. Any revision to the earnings outlook for a given market at a given time will lead to a revaluation of that market and a possible change in the risk premium ranking of markets.
PER = Price Earnings Ratio.
g = Expected earnings growth rate for the next two or three years.
r = Long-term interest rate on a risk-free bond (such as the 10-year US Treasury note).
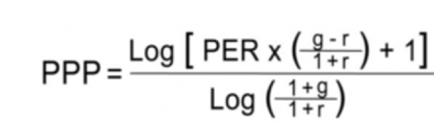
PPP = Potential Payback Period. This is the time needed for the investment in the purchase of a share to be "potentially recovered" through the sum of future profits growing at the rate "g" and discounted at the rate "r".
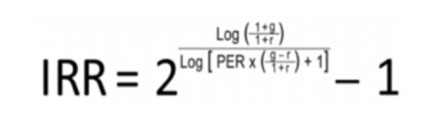
IRR = Internal Rate of Return. This is the discount rate that must be applied to future profits over the period corresponding to the PPP in order to equalise these profits with the current share price. The IRR formula is directly derived from the PPP formula.
Data source : Figures for P/Es (except for French stocks) and forecast earnings growth rates "g" for all markets come from Simply Wall St. research.
The average P/E for French stocks is provided by Boursophile.