
Observations and possible explanations
What do Euroapi, Worldline, Alstom, Téléperformance, Orpea and Atos all have in common? Eric Galiègue, Chairman of the SFAF's Valuation Committee, looks at recent episodes of extreme daily variations - both positive and negative - in the share prices of certain issuers, and the possible reasons for this volatility.
The full version of this article is available to "Expertise SFAF" subscribers only via this link.
In recent years, investors and analysts have been confronted with extreme episodes of daily volatility. Euroapi, the SANOFI subsidiary, and Worldline, the former Atos subsidiary, lost almost 60% in a single trading day, on 10 and 24 October 2023 respectively. Stocks such as Alstom, Téléperformance, Orpea and Atos have fallen by between 20% and 40% in a single day (-28% on 1 February 2024, +20% on 13 December 2023, -22% on 27 July 2023, to mention only those less than a year old). Are we seeing a real increase in price volatility? And if so, how can this be explained?
The facts
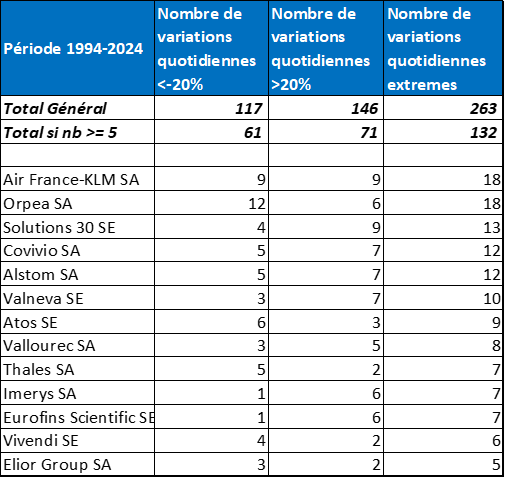
To measure changes in volatility, we have extracted from the Factset database the daily prices over the last 30 years of the stocks that currently make up the SBF 120 index, to calculate more than 730,000 daily variations. This period seems long enough to us, and includes episodes of high equity market volatility (2000-2002; 2008-2009; 2020; 2022). What's more, the stocks in the SBF 120 are large enough to avoid massive liquidity problems. Our exercise simply consists of counting, each day, the number of daily variations that exceed 20%, both upwards and downwards, and calculating a rolling average over 6 months. We have also determined a more traditional indicator of volatility, namely the standard deviation of daily performances, also calculated as a rolling average over 6 months. The table below shows the statistics relating to these extreme variations, for all the stocks in the sample:
 Source: Factset and Phiadvisor Valquant
Over the last 30 years, there have been 263 variations of more than 20% (i.e. 0.04% of total daily variations), including 117 variations of less than -20% and 146 variations of more than 20%. 13 stocks accounted for half (132) of the extreme variations (61 falls for 71 rises).
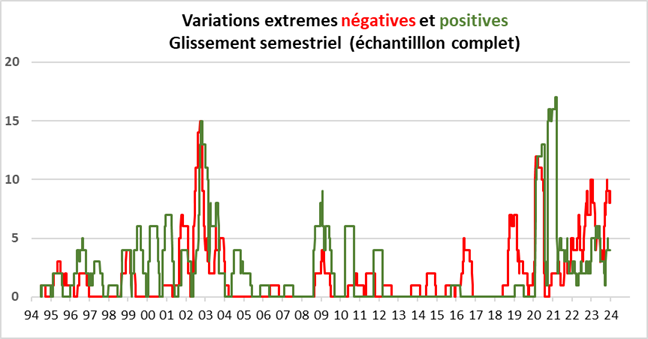
Rather counterintuitively, there were more extreme rises than extreme falls. The 'champions' of extreme rises include Imerys and Eurofins, with 6 extreme rises and only one extreme fall. Valneva also shows three times as many extreme rises as extreme falls. Extreme variations concern shares experiencing major financial problems: Orpea and Atos are the best-known and most recent cases, and Alstom to a lesser extent. Air France is suffering from the 'natural' volatility of a share that is coping with intense uncertainty over its revenues and costs (a cyclical sector, highly dependent on the price of fuel, and massively exposed to the health crisis, the risk of terrorist attacks and pilot strikes). Solutions 30, for its part, had to deal with an "activist" shareholder. The following graph shows the number of extreme positive or negative variations over a sliding 6-month period.
 Source: Factset and Phiadvisor Valquant
There was an increase in negative extreme variations at the end of the period, whereas positive extreme variations were more frequent than negative extreme variations at the beginning of the period (at the end of the 90s and in 2000).
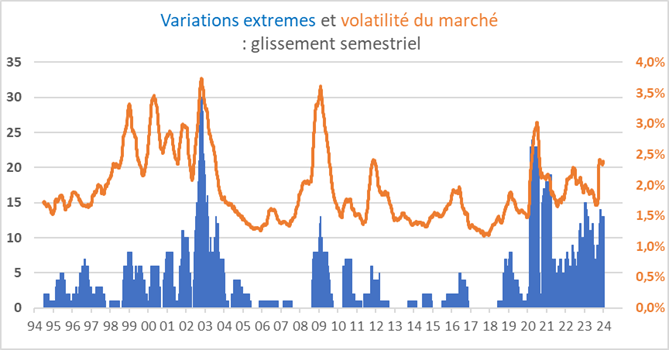
The following chart is the most explicit. The orange curve for market volatility shows a downward trend, apart from the episodes of 2008-2009 and 2020, while the blue curve for the number of extreme variations is denser and reflects an increase in what might be called 'hyper-volatility'.
Source: Factset and Phiadvisor Valquant
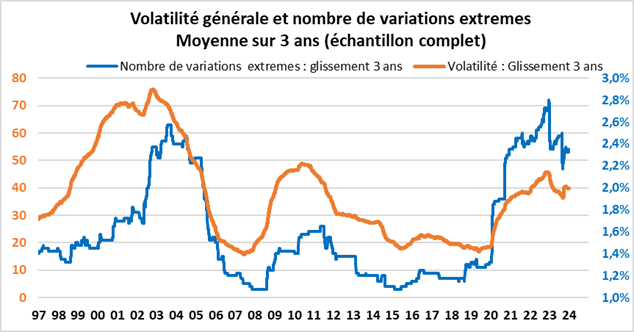
This is even more obvious when we calculate the two volatility indicators over a rolling three-year period:
 Source: Factset and Phiadvisor Valquant
Possible explanations
We can put forward several explanations for the increase in the frequency of extreme daily variations. Some relate to equities themselves, others to the market.
A/ Explanations relating to equities themselves
What is known in quantitative analysis as "survivor bias" could explain the rise in extreme variations: stocks that were once part of the SBF 120 have sometimes disappeared or suffered very significant falls (Eurodisney, Eurotunnel, Casino, EDF, etc.). They are therefore excluded from the measures taken on the basis of stocks that exist today, and their high volatility in previous years is not measured. The increase in extreme variations observed over the last 3 years is largely attributable to 2 cases: Atos and Orpea. Their exclusion from the sample would call into question the finding of an increase in extreme variations. Because of a lack of follow-up analysis, or a desire to deceive or hide the truth, some stocks have been deluded for years before collapsing: this would no longer be true today...
B/ Market-related explanations
The notion of liquidity is complex to measure, but it seems to us that the "real" liquidity of shares is decreasing: as soon as very unfavourable news becomes known, sellers can no longer find buyers, which explains the massive price shifts. The main reason for this is probably the fact that there are fewer and fewer 'fundamental' investors. They can now be considered to have become a very small minority: there is no longer anyone to stand in front of the sellers, in the name of the contrarian spirit and the adage "buy at the sound of the gun". On the contrary, the rise of passive management has had the effect of accentuating the trend, and never opposing it.
The full version of this article is available to "Expertise SFAF" subscribers only via this link.